 ⭐️
⭐️
Web UI
Start Here
Use REST API and Web UI as the main operations entry point. That page explains when to enable the HTTP service, which REST API pages to read next, and how Web UI fits into day-to-day operations.
This page focuses on the Web UI screens themselves and the current capability boundary of the built-in console.
Access
Before accessing Web UI, enable the SeaTunnel Engine HTTP service in seatunnel.yaml:
seatunnel:
  engine:
    http:
      enable-http: true
      port: 8080
Then visit:
http://<host>:8080/#/overview
If context-path is configured, include it before the hash route:
http://<host>:8080/<context-path>/#/overview
Overview
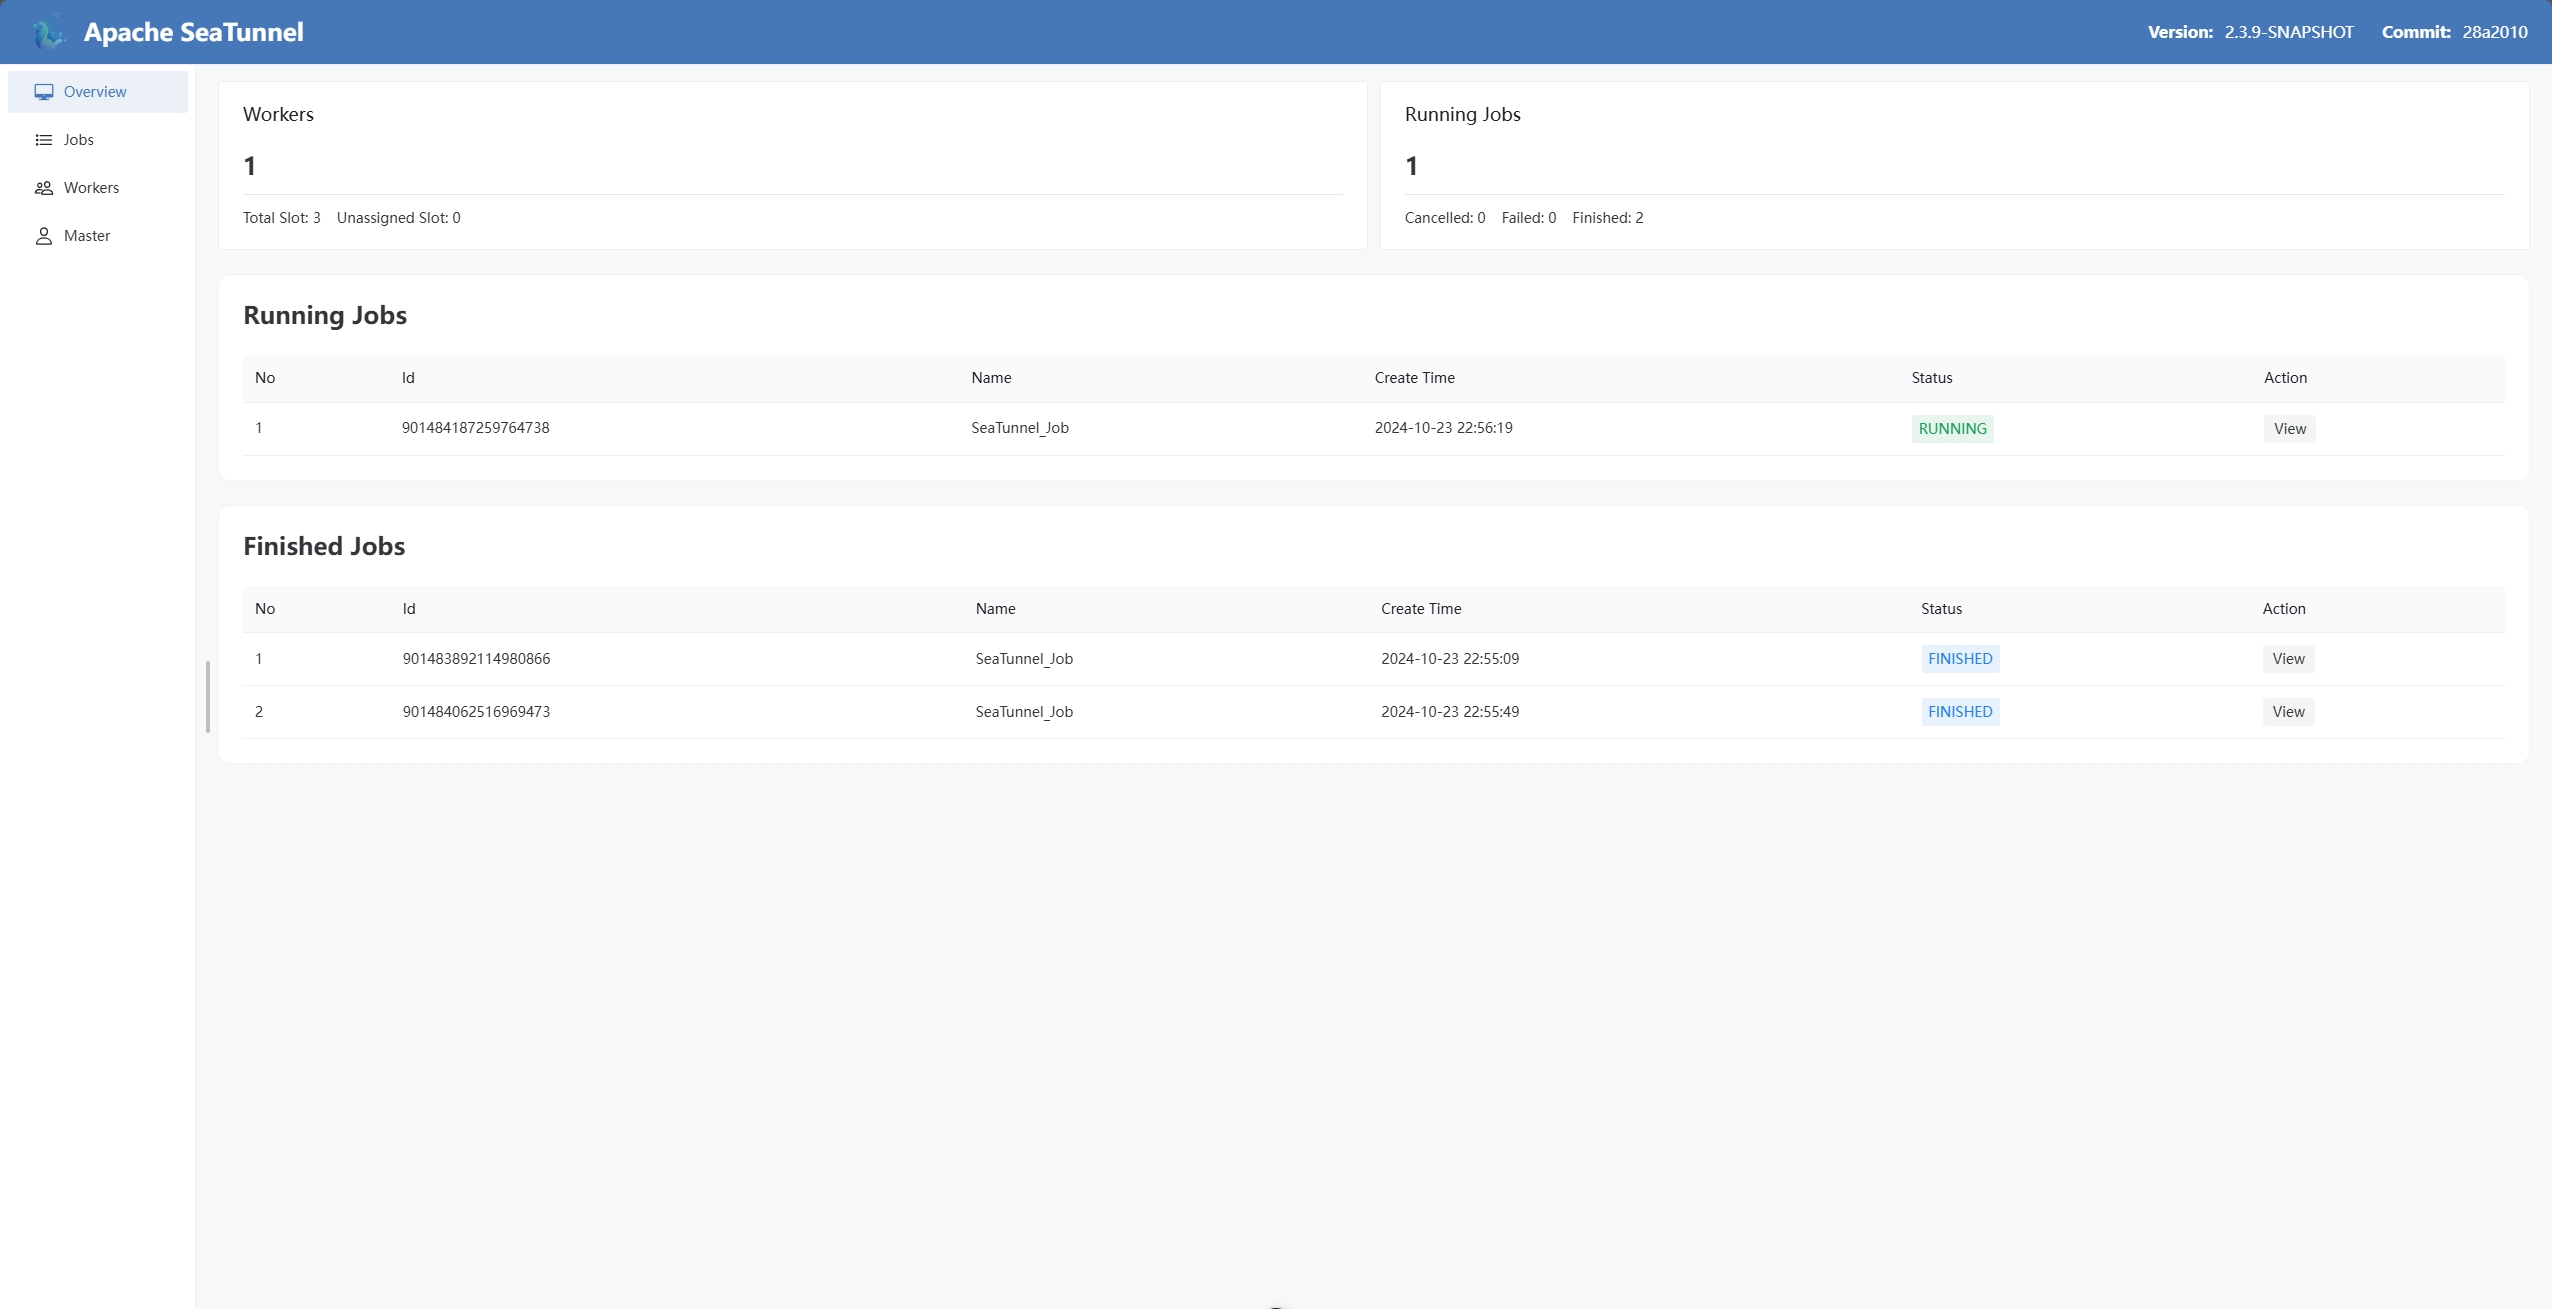
The Web UI of Apache SeaTunnel is a visual inspection console for SeaTunnel Engine. It helps operators view cluster overview data, running and finished jobs, job detail pages, logs, realtime DAG metrics, and the status of worker and master nodes.
The Web UI does not submit jobs or provide lifecycle control actions such as cancel, stop, savepoint, or restore. Use the REST API or CLI when you need those operations.
Capability Summary
| UI area | Current capability |
|---|---|
| Overview | View cluster version, slot usage, worker count, and job counts |
| Jobs | View running and finished jobs, paginate job lists, and open job details |
| Job Detail | View DAG, job metrics, exception text, job configuration, logs, and realtime observability data |
| Workers | View worker-node system monitoring information |
| Master | View master-node system monitoring information |
Jobs
Running Jobs
The "Running Jobs" section lists SeaTunnel jobs that are currently in execution. Users can view job ID, job name, creation time, status, and open a detail page for a specific job.
The list refreshes periodically and supports pagination.

Job Detail
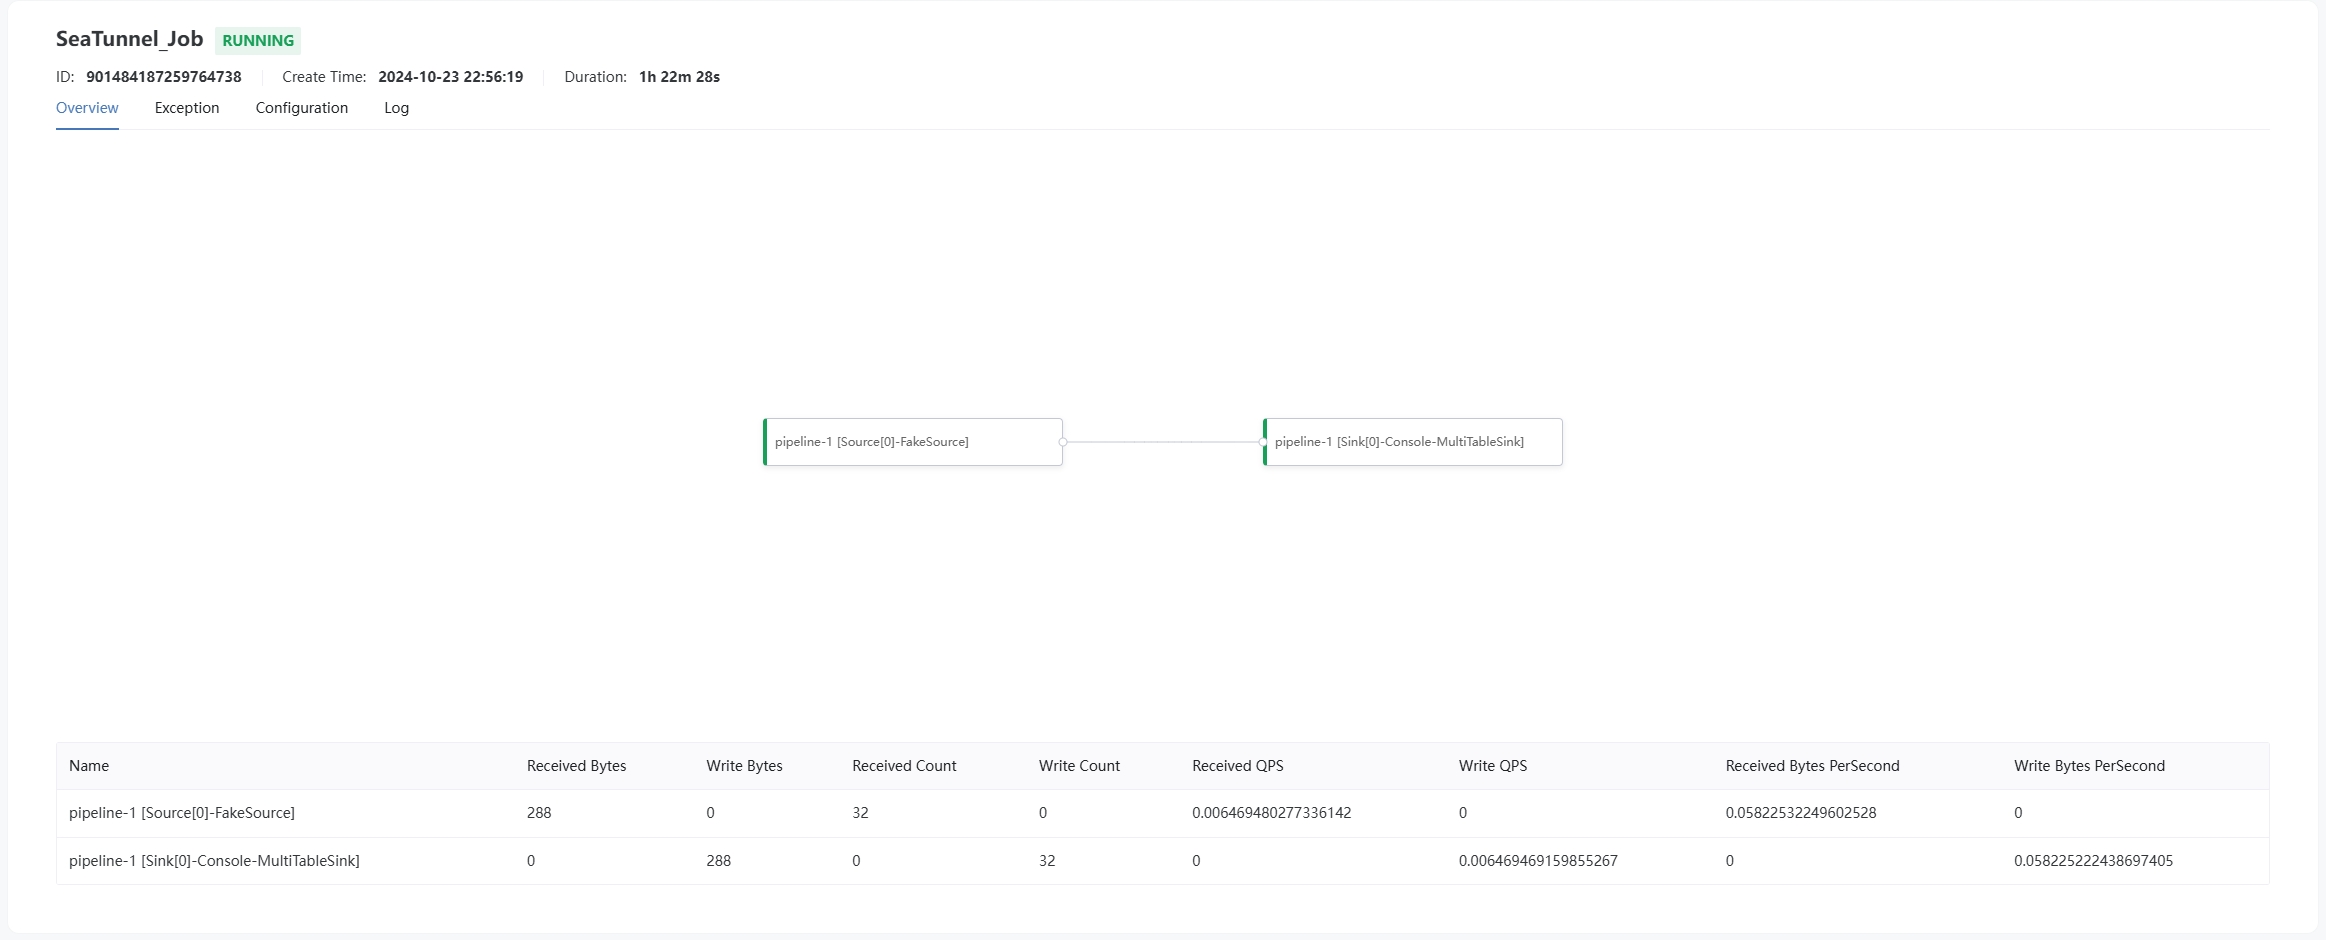
The Job Detail page contains four main tabs:
- Overview: shows the job DAG, source and sink throughput metrics, flush-signal metrics, and realtime vertex or edge metrics when observability is enabled.
- Exception: shows the job error message when the job has failed or reported an exception.
- Configuration: shows the runtime job configuration exposed by the engine.
- Log: shows job log files returned by the engine log API.
Realtime Observability
On the Job Detail page, the DAG view can display realtime metrics for the recent window (3 minutes by default, up to 10 minutes):
- Vertex busyness: busy and idle ratios for Source, Transform, and Sink vertices.
- Edge downstream wait ratio: when the job inserts queues at async boundaries or before Sink IO, edges are colored and thickened by downstream wait ratio and queue fill ratio.
- Interaction: click a vertex or edge to open the detail drawer and view realtime curves and key fields.
- Pinned live chart: pin one or more numeric metrics from the drawer so live charts remain visible on Overview after the drawer closes. Series are split by unit (ratio, duration, records) so mixed scales stay readable; same-unit metrics overlay for comparison. See Live Metrics Chart for pin lifecycle, the 6-series limit, and shared polling cost.
This capability requires the job to enable env.engine.observability or configure an option that auto-enables it, such as async_boundaries or split_sink_io. See Realtime Observability for configuration and metric semantics.
For the runtime graph design boundary and large-DAG fallback rules, see Runtime Execution Graph.
Finished Jobs
The "Finished Jobs" section displays jobs that have reached a terminal state, such as finished, failed, cancelled, or savepoint done. Users can review historical records and open the detail page to inspect configuration, exception text, metrics retained by the engine, and logs.

Workers
Workers Information
The "Workers" section displays system monitoring information for worker nodes. Use it to inspect worker address, resource status, and runtime health signals exposed by the engine.
The table shows process CPU, heap used/max, physical memory, GC counts, threads, and slots. Details opens all system monitoring fields and the worker's resource-manager snapshot: available/total CPU and heap resources, heartbeat CPU/memory usage, tags, and running job count.
The worker table scrolls horizontally on narrow screens. The Details column scrolls with the data instead of covering it, and long slot descriptions wrap within their column. The existing sidebar collapse control remains available.
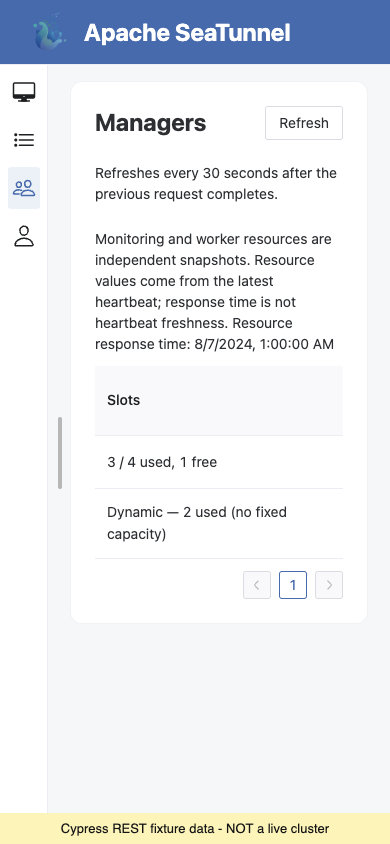
- Fixed-slot workers show used/total and free slots. Dynamic-slot workers show only used slots and an explicit dynamic label: tracked slots are not capacity.
- Missing values are shown as
—, not zero. Monitoring-only and resource-only workers remain visible; an unavailable endpoint displays a warning and clears its old values. An unavailable resource snapshot is not an empty cluster. - The page refreshes 30 seconds after the previous requests finish, with at most
one refresh in flight. Refresh requests an immediate update. Polling pauses
while the browser tab is hidden and refreshes when it becomes visible again.
An already-running refresh is allowed to finish before a new one starts.
Leaving the page stops polling. The table paginates locally; each Workers
refresh sends two HTTP requests from the browser. On the server, the monitoring
endpoint dispatches one RPC per cluster member concurrently, so its fan-out
is O(n) for n members, not constant-cost. Responses are collected against one
shared deadline (
seatunnel.engine.health-metrics-timeout-seconds, 3 seconds by default); members that miss it are reported with atimeouterror marker. The browser's 6-second timeout does not cancel server-side operations. This UI change does not alter backend RPC or timeout behavior. - Monitoring and resource-manager values are separate samples. Resource response time is when the master built the resource response, not when a worker last sent a heartbeat. It cannot establish heartbeat freshness.
This is a read-only view using the existing monitoring and
/resource/workers endpoints. Task-to-worker drill-down and
historical metrics are not included. The Master page shows monitoring details
only and does not request worker resource data.
The screenshots below show the actual UI with deterministic Cypress REST fixtures, not a live cluster. The table includes a fixed-slot worker and a dynamic-slot worker; missing measurements remain unavailable rather than appearing as zero.
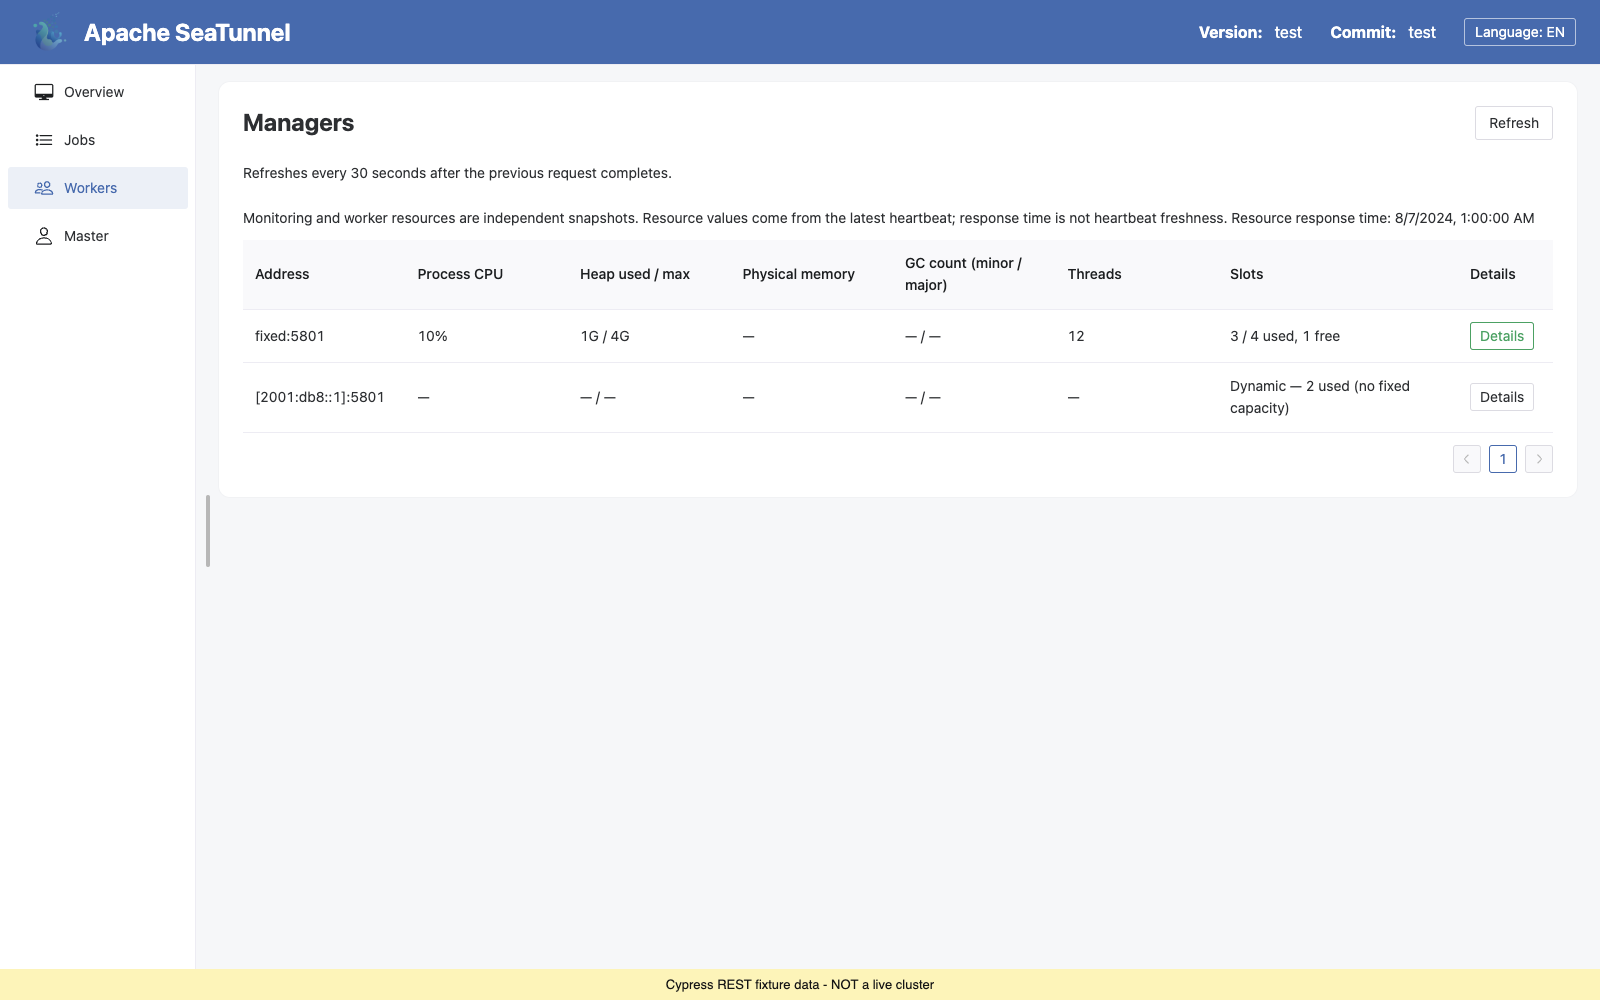
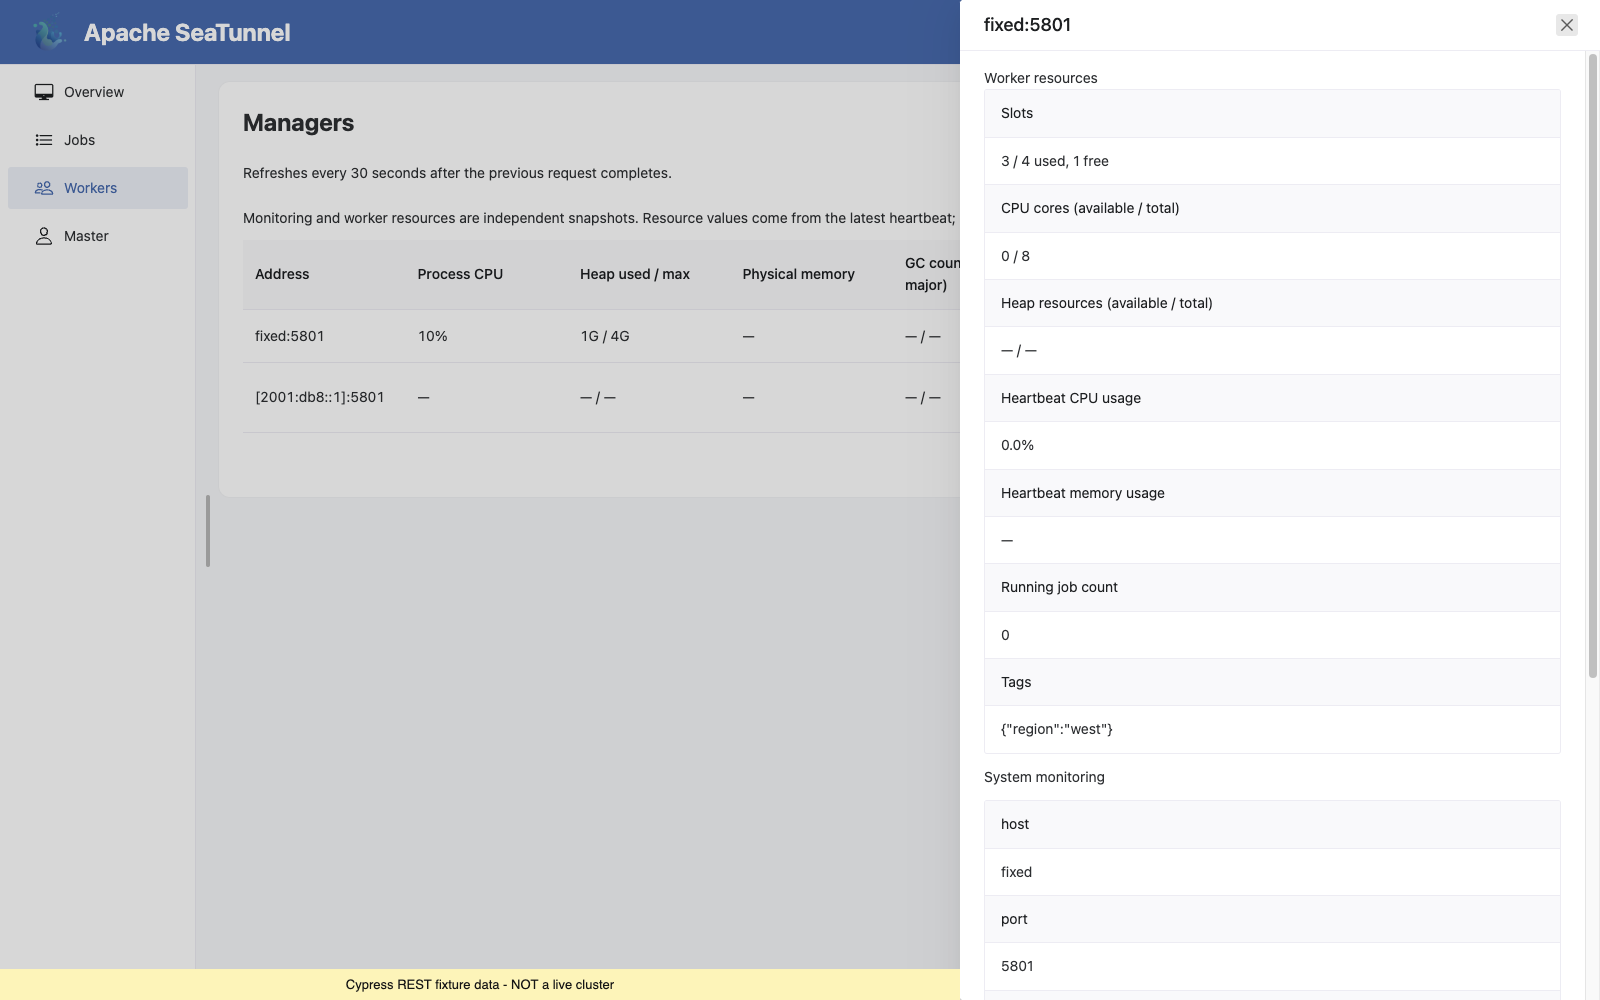
On a narrow screen, collapse the sidebar and scroll the table horizontally to inspect the slot summary or reach Details.
Master
Master Information
The "Master" section displays system monitoring information for master nodes. Use it to inspect the current master-side runtime state and resource signals exposed by the engine.
